

Climate control optimisation workflow for system designers
A climate control optimisation workflow is a repeatable sequence: define objectives and KPIs → establish a metered baseline → build a TM54-aligned simulation that models actual control logic → select a control strategy (PID, MPC, optimum control, or temperature integration for greenhouses) → integrate through a BMS using BACnet or Modbus → commission seasonally per CIBSE AM17 → verify continuously against BS-EN 15232 benchmarks. For most existing buildings, the lowest-friction entry point is BMS analytics and set-point tuning before any hardware investment, following the BBP Managing for Energy Performance framework recommendation to audit against BS-EN 15232 Class A before committing capital.
Produce four artefacts before anything else:
- Performance brief: objectives, comfort criteria, energy targets, and KPI definitions
- Metering plan: whole-building and sub-metering points, sampling rates, and data-access routes
- Simulation brief: tool selection, control-logic scope, off-axis scenarios, and TM54 or BRE Design for Performance alignment
- Commissioning plan: seasonal schedule, acceptance criteria, and responsibility matrix
Key takeaways
A climate control optimisation workflow delivers verified energy and comfort outcomes only when modelling fidelity, BMS-first tuning, and seasonal commissioning are treated as non-negotiable stages rather than optional extras.
| Point | Details |
|---|---|
| Start with BMS audit, not hardware | Audit against BS-EN 15232 Class A before any capital spend; set-point tuning alone often delivers measurable savings. |
| Model control logic explicitly | Replace default part-load curves with manufacturer data and run at least four off-axis scenarios per BRE Design for Performance. |
| Commission seasonally per AM17 | Complete both winter and summer commissioning cycles; record part-load COP and compare against the simulation model. |
| Track KPIs continuously | Monitor energy use intensity, peak demand, degree-hours outside comfort band, and seasonal COP against a normalised baseline. |
| Akita for local delivery | Akita provides site audits, BMS optimisation, controls installation, and maintenance memberships across Suffolk, Norfolk, and Essex. |
Table of Contents
- What does a complete climate control optimisation workflow look like?
- How should you model controls to avoid post-occupancy performance gaps?
- Which control strategies should you consider for your system?
- What should you measure, and where should sensors go?
- How do you integrate a BMS and handle retrofit constraints?
- Commissioning, KPIs and seasonal verification
- Common pitfalls, timelines and cost guidance
- How Akita approaches this workflow in practice
- Who should run optimisation, and how should you contract for it?
- Akita can help you put this workflow into practice
- Sources
What does a complete climate control optimisation workflow look like?
The workflow below is structured around seven stages. Each stage has a named owner, a minimum deliverable, and a gating criterion before the next phase begins. The indicative timeline assumes a medium-sized commercial building or protected-cropping facility; smaller sites compress the pilot phase, larger estates extend roll-out.
| Stage | Owner | Minimum deliverable | Gating criterion | Indicative duration |
|---|---|---|---|---|
| 1. Objectives & KPIs | Asset/energy manager | Performance brief, KPI register | Signed-off brief | 1–2 weeks |
| 2. Baseline metering & data validation | M&E designer + BMS specialist | Metering plan, validated dataset | 4–8 weeks of clean data | 4–8 weeks |
| 3. Energy & thermal modelling (TM54) | Modeller | Simulation log, calibrated model | Model within ±10% of metered baseline | 3–6 weeks |
| 4. Control-strategy shortlisting | Controls integrator | Control logic spec | Client sign-off on strategy | 1–2 weeks |
| 5. Pilot implementation | BMS specialist + controls integrator | Pilot report with A/B results | KPI improvement confirmed | 2–4 months |
| 6. Full integration & roll-out | Controls integrator + M&E | Integrated BMS with point-to-point map | Functional acceptance test passed | 3–12 months |
| 7. Seasonal commissioning & monitoring | Operator + BMS specialist | AM17-aligned commissioning record, live dashboard | Two seasonal cycles verified | Ongoing |
The LETI Operational Modelling Guide recommends repeating the modelling step at each design stage rather than treating it as a one-off exercise. That iterative approach is what prevents the simulation from drifting away from the as-built system before commissioning even starts.
The handover points between stages are where programmes most often stall. Assign a named individual to own each handover, and write data-access obligations into contracts from Stage 1.
How should you model controls to avoid post-occupancy performance gaps?
The single most common cause of post-occupancy underperformance is a simulation that uses default part-load curves and simplified control logic. BRE Design for Performance requires modellers to represent actual control-system behaviour explicitly and to run a minimum of four single-factor off-axis scenarios plus one combined scenario. The CIBSE TM54 methodology sets the standard for non-domestic buildings, requiring quasi-steady-state or dynamic simulation that reflects operational schedules and control logic rather than idealised conditions.
Modelling checklist
- Replace simulator default part-load curves with manufacturer-supplied data for every major plant item (chillers, heat pumps, boilers, fans, pumps)
- Model economy cycles, including the control logic that enables and disables them
- Model fan and pump turndown under variable-speed drive control
- Include at least four off-axis scenarios: failed CO₂ sensor, disabled economy cycle, increased overnight infiltration, and tighter control deadbands
- Include one combined off-axis case (e.g. failed CO₂ sensor coinciding with higher overnight infiltration)
- Validate the model against the metered baseline before using it to predict savings
Four example scenarios worth running in every model:
- Failed CO₂ sensor: the BMS defaults to maximum fresh-air rate, inflating heating and cooling loads
- Disabled economy cycle: a common maintenance workaround that persists for months unnoticed
- Increased overnight infiltration from poorly maintained door seals or damper failures
- Tighter control deadbands than design intent, causing plant to short-cycle
The LETI guide reinforces this: select the right modelling tool for each design stage and repeat the exercise through concept to operation, not just at RIBA Stage 4.
Pro Tip: Maintain an explicit point-to-point map between simulated control logic and BMS control points. When the system is handed over, the modeller can update the simulation to match the as-built configuration in hours rather than weeks, making post-occupancy calibration far less painful.
Which control strategies should you consider for your system?
For predictable single-zone systems with slow thermal dynamics, a well-tuned PID controller with adaptive set-point schedules remains practical and low-cost to integrate. For multivariable distribution systems, energy-constrained sites, or facilities where comfort and energy targets are in tension, model predictive control (MPC) or rule-based optimal control typically delivers measurable gains.
PID with adaptive scheduling
PID is mature, widely supported in BMS platforms, and requires no external forecast data. Its weakness is that it reacts rather than anticipates: a cold snap overnight will cause a building to undershoot its morning warm-up target unless the start time is adjusted manually or by an optimum start controller. Integration cost is low, and fallback behaviour is well understood by operators.
Model predictive control
MPC uses a rolling forecast horizon (typically 24–48 hours) and a thermal model of the building to pre-condition the space, shift loads away from peak tariff periods, and satisfy comfort constraints simultaneously. The energy and comfort gains are real, but MPC needs reliable weather forecast inputs, a calibrated building model, and a controls integrator who understands the solver. Forecast inputs from Met Office APIs or similar services are now accessible enough that this is no longer a barrier for most commercial projects.
Optimum control and temperature integration
Temperature integration is particularly effective in greenhouses. Rather than holding a fixed set-point, the controller manages a temperature integral over a 24-hour window, allowing the space to run warmer during low-loss periods (calm, sunny days) and cooler during high-loss periods (windy nights). Simulation studies show annual energy savings ranging from a few per cent up to approximately 20% depending on system characteristics and the allowable deviation from the target integral. The AHDB optimal control programme demonstrated this in practice: a control algorithm received Met Office forecast data, varied hourly set-points, and adjusted them inversely with wind speed to reduce heat consumption while maintaining grower acceptance.
Transpiration-based control
For protected-cropping environments, transpiration-based algorithms go further than temperature integration by incorporating plant water-status signals to drive ventilation and humidity decisions. This is plant-centric rather than energy-centric, but the two objectives align well when the algorithm is tuned correctly.
Implementation notes that apply across all strategies: define set-point constraints and supervisory logic to prevent simultaneous heating and cooling; build in fail-safe modes for sensor failures; and surface manual override and alarms in the BMS operator interface, not just in the controller software.
Pro Tip: Before committing to MPC or any advanced controller across a whole site, run a short A/B pilot on a representative zone. Two to four weeks of side-by-side data is usually enough to confirm whether the energy and comfort claims hold in your specific building.
What should you measure, and where should sensors go?
Reliable control depends on reliable data. A sensor that drifts by 2°C or a CO₂ transmitter that reads high because it is mounted near a supply diffuser will corrupt the control loop and make post-occupancy analysis meaningless.
Essential measurements
- Zone dry-bulb temperature (primary control variable)
- Outdoor temperature and relative humidity
- Zone CO₂ concentration (demand-controlled ventilation)
- Zone relative humidity (comfort and mould-risk management)
- Occupancy (PIR, desk sensors, or calendar/schedule data)
- Supply and return water temperatures for heating and cooling circuits
- Flow metering on primary circuits
- Electrical sub-metering for HVAC plant (fans, pumps, chillers, heat pumps)
- Weather forecast data via API (Met Office DataHub or equivalent)
- Solar irradiance where passive gains are significant
For greenhouses, add: leaf temperature or transpiration sensors, thermal-screen position feedback, soil moisture sensors, and PAR (photosynthetically active radiation) meters.
Sensor placement guidance
| Sensor type | Placement guidance | Common error to avoid |
|---|---|---|
| Zone temperature | Approximately waist height, away from direct solar radiation and supply diffusers | Mounting near a window or in a supply-air stream |
| CO₂ transmitter | Breathing zone, representative of occupancy pattern | Near supply diffuser (reads low) or near door (reads high) |
| Outdoor temperature/RH | Ventilated, shaded housing on north-facing surface | Unshaded surface causing solar gain error |
| Supply/return water temperature | Immersion pocket on pipe, insulated | Surface-mount clip-on sensors without insulation |
| Weather station (greenhouse) | Clear of obstructions, at crop height for wind speed | Mounting on roof ridge where turbulence distorts readings |
Data-quality checklist
A sensor that is physically correct but poorly integrated is nearly as bad as a misplaced one. Before going live, verify:
- Sampling rate is appropriate (1-minute for fast-acting loops, 15-minute for trend analysis)
- Timestamps are synchronised across all data sources (NTP or BMS clock discipline)
- Sensor drift detection is configured (alarm on deviation beyond a plausibility threshold)
- Backfilling rules are defined for short outages
- Plausibility checks are active (e.g. zone temperature outside 10–35°C triggers an alarm)
The AHDB humidity control guidance illustrates how small set-point refinements and staged controls can improve humidity management with minimal energy penalty — but only when the humidity sensor is correctly placed and calibrated.
How do you integrate a BMS and handle retrofit constraints?
Protocol choice is largely determined by what is already installed. BACnet/IP and BACnet MS/TP remain the dominant protocols for building-level integration in the UK; Modbus TCP/RTU is common for plant-level devices (chillers, heat pumps, inverter drives); OPC UA suits analytics layers where interoperability with multiple vendors matters; MQTT is increasingly used for IoT sensor layers where low-latency determinism is not required.
For retrofit projects, the pragmatic question is whether the existing BMS has enough visibility and writable points to support optimisation without hardware changes. A BMS specialist should review O&M documentation and drawings before any optimisation engagement begins. BBP guidance is explicit: audit the BMS strategy against BS-EN 15232, grade the system, and produce an upgrade plan. Achieving Class A efficiency through set-point tuning, schedule optimisation, and trend analytics often costs a fraction of hardware replacement and can be completed within weeks.
When hardware changes are justified, prioritise variable-speed drives on fans and pumps, modulating control valves on reheat coils, and thermal storage where time-of-use tariffs make load-shifting viable.
Cybersecurity essentials for any BMS integration:
- Segregate BMS networks from corporate IT using a firewall or DMZ
- Apply role-based access control: operators, engineers, and administrators have different permission levels
- Use secure, encrypted gateways for any cloud analytics connection
- Establish a patch management schedule for BMS controllers and edge devices
- Document remote-access routes and audit them annually
For new-build projects, specify cybersecurity requirements at RIBA Stage 2 and include them in the BMS performance specification. Retrofitting security controls onto an existing flat network is significantly more expensive and disruptive than designing them in from the start.
Commissioning, KPIs and seasonal verification
Commissioning is where the workflow either pays off or falls apart. A commissioning plan that lacks acceptance KPIs tied to metered data is not a commissioning plan — it is a functional test with no pass/fail criteria.
CIBSE AM17 sets out best practice for heat-pump installations including part-load performance checks, defrost cycle behaviour, buffer vessel sizing verification, and seasonal COP metering. The same seasonal structure applies to any HVAC system: winter and summer commissioning checks are not interchangeable, and a system that passes a summer test may still fail to meet heating targets in January.
Commissioning checklist
- Confirm metering is live and data is flowing to the analytics platform before any tuning begins
- Run a demand-led start/stop test: verify the optimum start controller advances or retards plant start time correctly against outdoor temperature
- Simulate an economy-cycle failure: disable the free-cooling signal and confirm the BMS alarms and falls back to mechanical cooling without operator intervention
- Simulate a CO₂ sensor failure: confirm the BMS defaults to a safe ventilation rate and raises an alarm
- Calibrate control deadbands: check that simultaneous heating and cooling is not occurring in any zone
- Verify heat pump defrost behaviour under cold conditions and confirm it does not cause comfort complaints
- Record part-load performance at 25%, 50%, 75%, and 100% load and compare against the simulation model
KPIs to track continuously
- Energy use intensity (kWh/m²/year): whole-building and HVAC sub-metered separately
- Peak electrical demand (kW): monthly maximum and demand-charge exposure
- Temperature integral / degree-hours outside comfort band: percentage of occupied hours outside the agreed comfort range
- HVAC run hours: plant operating hours versus scheduled hours (a ratio above 1.0 signals scheduling drift)
- Seasonal COP: metered heat output divided by metered electrical input over each seasonal period
For HVAC energy saving practices to translate into verified savings, KPIs must be tracked against a defined baseline, not just monitored in isolation. A dashboard that shows absolute energy consumption without a normalised baseline tells you nothing about whether the optimisation is working.
BS-EN 15232 provides the framing for grading BMS capability and setting improvement targets — use it as the benchmark against which each commissioning cycle is measured.
Common pitfalls, timelines and cost guidance
The most persistent failure mode in optimisation programmes is poor O&M documentation. A BMS specialist who cannot find the control logic drawings cannot verify whether the system is operating as designed. Before any tuning begins, a specialist should review O&M manuals, as-built drawings, and trend data to identify gaps. BBP’s framework makes this explicit: BMS optimisation steps including analytics, trending, and reduced plant operating hours depend on correct documentation.
Other common pitfalls:
- Mismatch between simulated and actual control logic (the model assumes economy cycles are active; the BMS has them disabled)
- Insufficient sub-metering (whole-building meters cannot isolate HVAC performance from process loads)
- Sensor placement errors discovered only during commissioning
- Occupier behaviour overriding automated controls (portable heaters, propped-open doors)
Indicative timeline and cost ranges
- Audit phase: 2–6 weeks, low cost (primarily specialist time for BMS review and metering assessment)
- Pilot phase: 2–4 months, moderate cost (BMS programming, metering installation, analytics platform)
- Roll-out phase: 3–12 months, capex varies significantly by hardware scope (VSDs and control valves at the lower end; thermal storage or heat-pump replacement at the higher end)
For greenhouses, the AHDB commercial demonstration reported approximately 24% energy saving with payback under 18 months for specific measures including modern moveable thermal screens and advanced climate control. BMS tuning alone typically has a shorter payback than thermal-screen investment, making it the right first step even on sites where screens are eventually planned.
Engage a Smart Building User Group at RIBA Stage 1 for new-build projects, as the RIBA Smart Building Overlay recommends, to align occupant needs with automated system configuration before design decisions are locked in.
How Akita approaches this workflow in practice
The checklist below reflects how a competent delivery team should apply this workflow on a real site. It is not theoretical: each item maps to a deliverable and a named responsibility.
Implementation checklist
- Site audit: review O&M documentation, BMS drawings, existing metering, and control logic; identify gaps and produce a performance brief
- Metering installation: install or verify sub-metering for HVAC plant, confirm data flow to analytics platform
- Baseline dashboard: establish a normalised baseline (weather-corrected kWh/m²) and define KPI thresholds
- Model build: construct a TM54-aligned simulation with manufacturer part-load curves, actual control logic, and at least four off-axis scenarios per BRE guidance
- Pilot controller: deploy and tune the selected control strategy on a representative zone; run A/B comparison for 4–8 weeks
- Seasonal commissioning: complete winter and summer commissioning cycles per AM17; record part-load performance and COP
- Handover and training: deliver updated O&M documentation, point-to-point map, and operator training before contract close
Sample rule-set snippets
Demand-led start/stop: the optimum start controller calculates plant start time as a function of outdoor temperature and the thermal mass index of the zone. If the zone temperature at 06:00 is within 1°C of set-point, plant start is deferred by 30 minutes.
Deadband policy: a 1.5°C deadband between heating and cooling set-points is enforced at the supervisory level. Any BMS trend showing simultaneous heating and cooling in the same zone triggers an automatic alarm and a maintenance ticket.
On weather-station failure, the MPC controller falls back to a fixed 24-hour schedule derived from the seasonal average.
Maintenance schedule for continuous tuning
- Monthly (first 3 months post-commissioning): review BMS trends for scheduling drift, deadband violations, and sensor anomalies; correct immediately
- Quarterly: produce a KPI report against the normalised baseline; flag any KPI outside the agreed tolerance band for investigation
- Annual: full seasonal re-commissioning; update the simulation model if plant or occupancy has changed; review BS-EN 15232 grade and set targets for the next year
For commercial HVAC cost-saving tactics to deliver sustained results, the maintenance schedule must be a contractual deliverable, not an aspiration. Drift post-handover is the norm, not the exception, when training and documentation are treated as afterthoughts.
Who should run optimisation, and how should you contract for it?
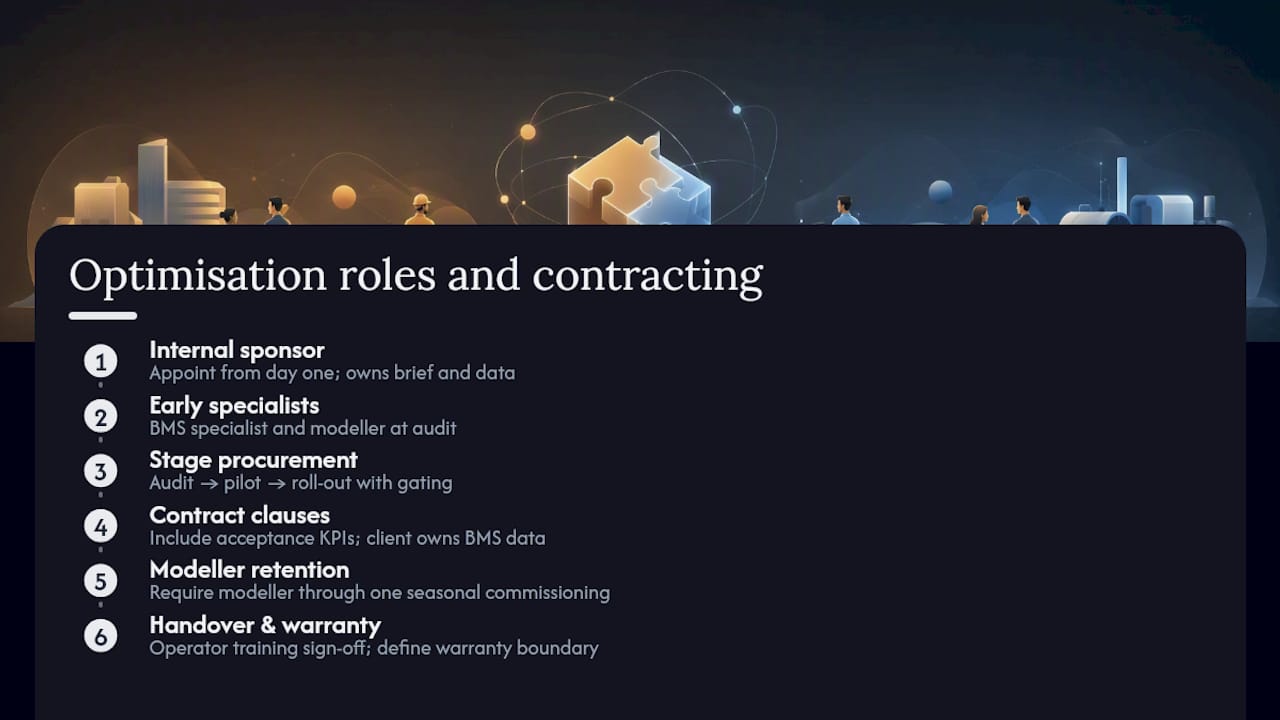
Appoint an asset or energy manager as programme sponsor from day one. This person owns the performance brief, chairs the handover meetings, and holds the data-access rights. Without a named internal sponsor, optimisation programmes drift when the external specialists leave.
Bring in a BMS specialist and a modeller at the audit stage, not after the design is fixed. The modeller’s value is highest when they can influence control-logic decisions before BMS programming begins; arriving at Stage 5 to validate a completed system is a much weaker position.
Contracting structure that reduces risk: stage-based procurement with defined gating criteria between audit, pilot, and roll-out. Include acceptance KPIs in the contract, not just functional test criteria. Require the modeller to remain engaged through at least one full seasonal commissioning cycle. Add a data-access clause that gives the client ownership of all BMS trend data and analytics outputs, regardless of which platform the integrator uses.
On performance warranties: be specific about what is and is not warranted. A controls integrator can warrant that the control logic operates as specified; they cannot warrant energy savings if the client changes occupancy patterns or process loads after handover. Define the boundary clearly in the contract.
Operator training and documentation handover must be contractual deliverables with a sign-off milestone. A system handed over without trained operators will revert to manual overrides within months. That is not a prediction; it is the most consistently reported failure mode in post-occupancy evaluations across UK commercial buildings.
Akita can help you put this workflow into practice
Delivering a commercial climate control installation that actually performs as designed requires more than specifying the right equipment. The workflow above demands site audits, metering, BMS reviews, controls installation, and seasonal commissioning — all coordinated by a team that understands both the engineering and the operational reality of the building.

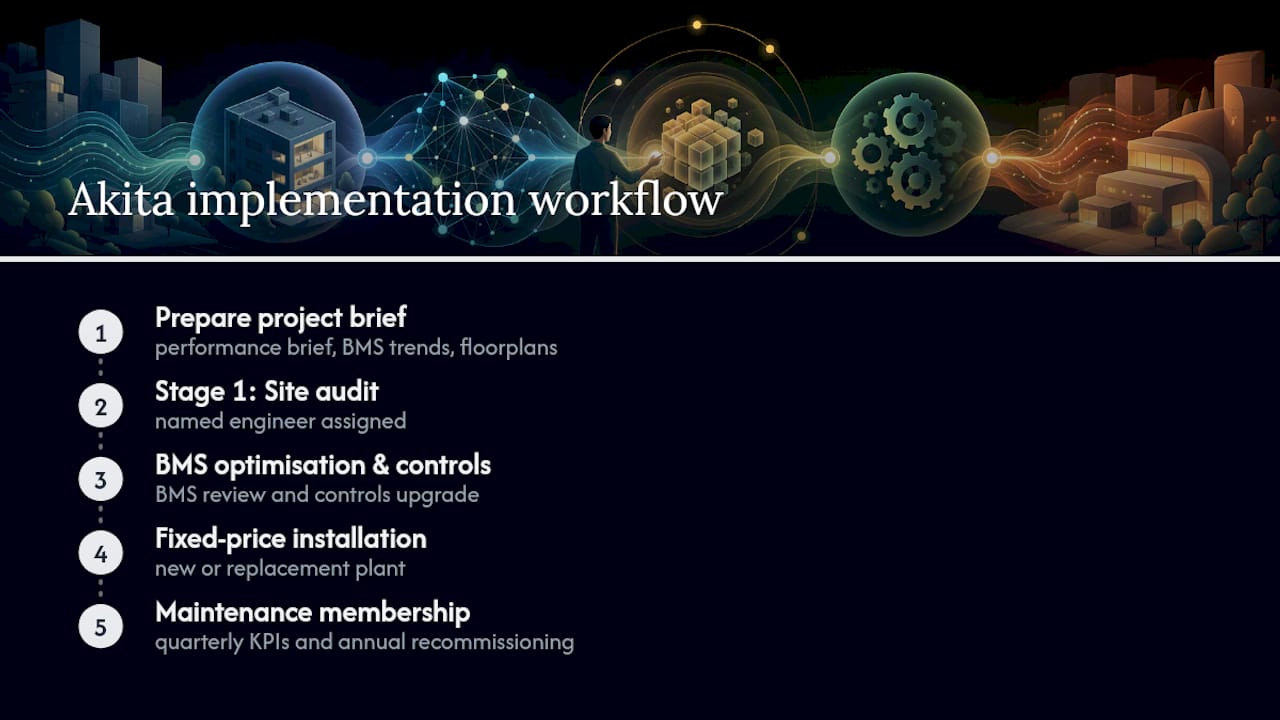
Akita provides exactly that sequence for commercial and residential clients across Suffolk, Norfolk, and Essex: site audits and metering assessments, BMS optimisation and controls upgrades, fixed-price installation for new or replacement plant, and ongoing maintenance memberships that include the quarterly KPI reviews and annual re-commissioning this workflow requires. The maintenance membership structure means the monitoring and tuning cycle does not stop at handover.
To get started, prepare a performance brief (objectives, comfort criteria, energy targets), confirm access to your BMS trend data, and have high-level floorplans available. Request a site audit from Akita and the workflow begins at Stage 1 with a named engineer, not a call centre.
Sources
- Building services: TM54 case study (CIBSE)
- Guide to design for performance (BRE Group)
- Optimum control of greenhouse heating (ISHS)
- Optimal control of greenhouse climate (AHDB)
- LETI operational modelling guide